
How I reverse-engineered my shopping list - Market basket analysis
#datamining #recommendation engine #market basket #analytics #apriori algorithm

Dear Reader,
New here? Wondering what is this about? Well, for the context, do Read this and then read on.
For Old folks here, Thank you so much for all the nice comments and support. These are few most liked posts on thinking category based on the most visited / commented (LinkedIn) / received DM, in case you missed:
if this catches your fancy, do subscribe:
Now off to this week post,
Have you ever been in the supermarket to buy diapers, and are suddenly been tempted to add a beer pack to your shopping cart? If you are living in the USA and the parent of a newly born baby, there is a high probability that you could have bought beer and diapers together.
THE BEER AND DIAPER STORY
In the 90s, It has been discovered by a supermarket in the USA that Customer who buyw diapers are likely to put beer in their shopping cart. Multiple reasons have been cited from masochism to the need to relax at home for this cooccurrence, but hard to pin down.
Although the origin of this story is not clear and could be traced back to 1992 - 96 (May be Tesco, May be Osco), the story offers a very interesting insight : Some items are being bought together. If the pattern could be identified, it can be used to improve sales.

The first time when I heard this story from an ex-colleague working in the data science team, I was tempted to test this theory in my own purchase. I found I buy haircare and moisturizer together, which is not so surprising pairing, unlike Beer and Diaper.
Now, the questions is - well, I know these are the products that are being bought together. What all I can do?
Recommendation engine - I can use this information to motivate my customers to buy product B, C while they are buying product A.
For example, if a customer is looking to buy spice rack,

You can also recommend other products, that you have observed people buy together

markdown - I can provide offers on products together. I can clear out the products that are slow-moving by combining those with their paired product that sell faster.
Item placement - Products that are sold together can be seen together.
Pricing strategy - If people are buying milk or bread both, it doesn’t make sense to offer any discount on both the products. If you offer discount on one, it will automatically drive the sale of another.


So How do you identify if there is any statistically significant correlation between the sale of Product A or Product B. Or more than 2 products.
Here comes the market basket analysis. drum roll, please

WHAT IS MARKET BASKET ANALYSIS?
Market basket analysis is a method to find meaning patterns in customer-level transaction data of products that are frequently bought together. This is based on the concept of Association rule mining.
HOW?
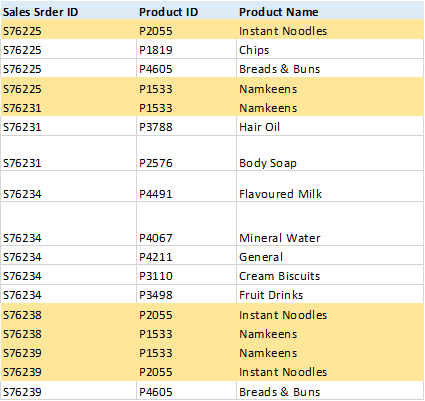
Let’s start with the basic concept. You would have this kind of transaction data:
Question 1 : What is the probability that product A - instant noodle and product B - Namkeen are being bought together?
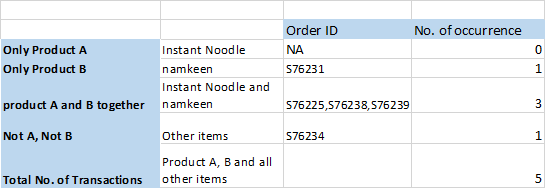
= Product A and B together / Total No. of transactions = 3/5 = 0.6
This is called Support. Support is how frequently {Instant Noodle, Namkeen} appears in the dataset.
Support of an itemset {product A, product B} is the co-occurrence of both Product A and Product B in the dataset.
Support indicates whether a rule is worth considering. For example, in Dataset of 1000000 transactions, even though 60 times product A, product B occur together, it doesn’t worth considering (Support, in this case = .0006) A threshold of support is specified while analysis.
Question 2 : If the customer has bought instant noodles, what is the probability that customer will buy Namkeen.
This is confidence. <This is conditional probability>
Confidence of P (B|A) = Probability of instant noodles and Namkeen / Probability of Instant Noodle
Probability of instant noodles and Namkeen = 0.6 (Support (A U B))
Probability of Instant Noodles = 3/5 = 0.6 (Only Instant noodles is not bought by any customer in our database) (Support (A ))
So Confidence of P (B|A) = 100%
This means that 100% of customers who buy Instant noodle, also buy Namkeen.
Confidence of P (A|B) = Probability of instant noodle and Namkeen / Probability of Namkeen = 0.6 / (4/5) =0.75
This means that 75% of customers who buy Namkeen, also buy instant noodle.
Basically, Confidence measures the percentage of times that item B is purchased, given that item A was purchased.
Question 3 : But is there any significant association between these two products or it happened by chance?
This can be measured by Lift.
Consider this scenario - if both the products are very popular among customers and hence, by chance even they are occurring together in the basket, there is no strong association. To investigate this, Lift is used. Lift considers both these events - Purchase of Product A, and Purchase of Product B as independent events from each other.
Lift = Support (A U B) / support A * support B
= 0.6 / (0.6*0.8) = 1.25
This is greater than 1, hence there is a positive relationship between product A and Product B.
Lift = 1; implies no relationship between A and B ( occurrence is by chance)
Lift > 1 => positive relationship
Lift <1 => Negative (Substitute to each other)
These 3 measures combined make up the association rule - If product A, then Product B
So now you see how I reverse-engineered my shopping list :) I know exactly what I generally order together :)
So that’s it for today. In coming posts, I will try to put a post together on exploratory analysis on real dataset using R. But it is suffice to know that as a category leader, you can take the advantage of these associations among products and this can be investigated by using Market Basket analysis. (Take the help of data science folk).
Alright, hope this was not a long post. And you stayed with me till now. If so, consider sharing this with your team, and stay tuned :)
Have a great day.