


Do you have a fair share of Distribution?
numeric distribution, product distribution, weighted distribution, POS

Dear Readers of Thinking Category,
First of all, thank you for your consistent support and for sharing the newsletter with your friends and colleagues in FMCG, e-commerce space 🤩.
We are now a community of 2600+ subscribers 🎉🎉🥂and growing every day. 30+ posts in 10 months. On average ~3 posts every month.
I’ve toyed with the idea of writing in the category management space for the last 4-5 years. But thanks to Netflix, Prime, and other entertainment opportunities, I have preferred lazing around in my free time. Pandemic was an eye-opener in many aspects of life - There is no tomorrow.
Do subscribe if you haven’t yet. 🙏
now off to today’s post.
In the previous posts, I have touched upon the aspects of Trade marketing and distribution as one of the important levers of category growth.
In one of the study it was found that the impact of distribution on brand metrics such as awareness, liking etc. is 11 times larger than advertising.1
From the brand perspective, how do you ensure the effective distribution of your products in category at the level of retail stores?
")
Some of the metrics that can help to evaluate brand availability and effectiveness of distribution strategies are:
Numeric Distribution
Weighted distribution
Share in shops handling (SISH)
As a category manager in FMCG, it’s important to know how your brands within the category are doing across distribution channels. These metrics will help to take corrective actions to improve topline and bottom-line (by reducing expense in unimportant channels or outlets)
WHAT IS NUMERIC DISTRIBUTION?
If you want to improve the distribution situation of your products, you can simply choose to be present everywhere. Numeric distribution tells you in how many stores are you present.
If you are selling Brand X belonging to the Bag category, and there are 1000 stores (or POS) selling Bags and your bags are being sold in 100 stores, the numeric distribution is 10%.
Numeric distribution = No. of stores your brand is present (and sell your brand category) / No. of total stores that carry any brand of the category in scope *100
- You can further add nuances such as stores that keep at least 10 SKUs to be considered in the equation to make it more reasonable. Or stores that sell at least 5 SKUs on weekly basis will be considered in Numerator.
- When you do a comparative analysis, if your no. is too low, it shows the poor distribution. While if the no. is too high you might spread yourself quite thin. For example, if your brand is present in two stores located close to each other, you might not be adding anything from the sale contribution perspective.
- If you have region-wise numeric distribution, you can identify barriers for market development in a particular region.
Hypothetical case : this is how the distribution for your brand (Brand X) and your competitors (y, z) looks like :

Store C and D, each keep only 1 brand. And there are only 4 stores that keep the category the brand in question belongs. Numeric distribution for Brand X is 75%, higher in comparison to other brands.

But does this tell you if you are present in “key” stores where sales are high? Presenting in most of the stores while missing from the stores where consumers goes mostly might not be a good idea. Weighed distribution is the metric that lets you evaluate this.
WHAT IS WEIGHTED DISTRIBUTION?
Weighted distribution tells you the quality of your distribution. If the weighted distribution is low and numeric distribution is high, it means that you are available in most of the stores but you are not present in stores that matter. (In short, stores are weighted by the importance to calculate weighted distribution)
Let’s expand on the same case,
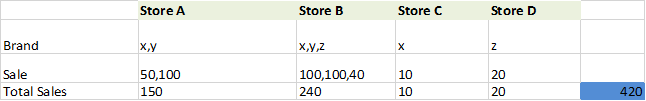
Store B is the important store from the category sale perspective and all the brands are available there. (All the values in rupees)
Brand X is present in store A, B, C where total sales is =150+240+10 = 400. Total sale is 150+240+10+20 = 420.
For brand X, weighted distribution is 95%. Simply what it means is, that Brand X is sold in stores which accounts for 95% of category sales.

This shows that Brand A is present in all the stores that matter. Sale in Store C is only 20 so it doesn’t matter if Brand x is not present in Store C.
But assume that this is the case:

The weighted distribution of Brand X has gone down because it is not present in the Store C and that is an important store from category sales perspective.

On the other end, even though numeric distribution for Brand z is 50%, same as Brand x, y but its weighted distribution is higher because of its presence in store C which is an important stores from category sales perspective.
SISH is calculated by dividing the brand sales by the total category sale of stores that sell the brand in scope.

Here the denominator is the same for Brand X and Y because both the brands are available in the same place in this hypothetical case.
Brand Y SISH is higher. This shows that consumers prefer Brand Y more if both the brands are available. SISH brings consumer perspective into the equation.
You can combine all this information with other indices such as out of stock index, geographic spread, the share of shelf and get some interesting insights to improve the brand availability further.
Would love to hear your distribution strategy:
Have a great week :)
https://www.researchgate.net/publication/259952582_Consumer_Attitude_Metrics_for_Guiding_Marketing_Mix_Decisions
Great read..but curious how do you obtain info on all stores and brands specific information from them? Is there a easy source ?